

| Concept | Title | Description |
|---|---|---|
1.  |
Active redundancy, with repair | Calculate the effective failure rate of "n" active on-line units with equal failure rates where "m of n" are required for success. Failed units can be repaired. | 2.  |
Active redundancy, with repair, Weibull | Calculate the effective failure rate of "n" active on-line units with equal failure rates where "m of n" are required for success. Failed units can be repaired. Determine the reliability function, probability density function and hazard function for a wide variety of failure distributions using the Weibull distribution. Calculate the mean time to failure for non-repairable scenarios. Create plots of R(t), f(t) and h(t). Output derived functions to a Microsoft Excel formula format. | 3.  |
Active redundancy, unequal failure rates, with repair | Calculate the effective failure rate of two units with different failure and repair rates, where "1 of 2" are required for success. Failed units can be repaired. | 4.  |
Active redundancy, with one cold standby spare unit | Calculate the effective failure rate of a configuration that has a single off-line standby unit, or "cold spare," with "n" active on-line units, all having equal failure rates. "n" active on-line units are required for successful operation. Failed units can be repaired. | 5.  |
Active redundancy, arbitrary number of cold standby spare units | Calculate the effective failure rate of a configuration that has multiple off-line standby units, or "cold spares," with "n" total units, all having equal operating failure rates. Determine the reliability function. Calculate the mean time to failure for non-repairable scenarios. Create plots of R(t) and output the derived reliability function to a Microsoft Excel formula format. | 6.  |
Active redundancy, equal failure rates, without repair | Calculate the effective failure rate of "n" active on-line units with equal failure rates where "m of n" are required for success. No repair of failed units is possible. | 7.  |
Active redundancy, unequal failure rates, without repair | Calculate the effective failure rate of two units with different failure rates, where "1 of 2" are required for success. No repair of failed units is possible. | 8.  |
Active redundancy, with one cold standby spare unit, without repair | Calculate the effective failure rate of a configuration that has a single off-line standby unit, or "cold spare," with "n" active on-line units, all having equal failure rates. "n" active on-line units are required for successful operation. No repair of failed units is possible. | 8a.  |
Discrete event simulation | This tool simulates the failure and repair process for different units, each with an independent failure and repair distribution, using discrete event simulation techniques. It allows for a user defined "watch list" of failure events that result in a "critical" failure; thereby allowing the calculation of mean time between critical failure (MTBCF) and operational availability (Ao) for more complex system reliability modeling problems. It allows exporting results to Microsoft Excel for further post simulation analysis. | 9.  |
State enumeration and reliability | This tool enumerates possible states and calculates overall system reliability (probability of success). It can generate the system reliability function, R(t), using both the Weibull and Exponential distributions, and calculate the effective system mean time between failure (MTBF) for units with unequal failure rates. It allows the user to define specific system states as either successful or unsuccessful, thereby allowing for finer granularity closed-form (non-simulation) models. | 10.  |
Environmental impact on MTBF | This tool estimates the impact on equipment MTBF from changes in operating environment, average internal operating temperatures and part quality levels based on Mil-Hdbk-217F relationships. | 11.  |
System availability calculator | Calculate and plot combinations of MTBF and Mean Restoration Time (MRT) that result in a desired system availability. | 12.  |
Spares analysis | Calculate the number of spares required to be "x%" confident that there will be sufficient spares available until the next restocking point. | 13.  |
Spares analysis, multiple PNs | Calculate spares for a bill of materials. Vary confidence level and turn-around-time (TAT) by part number (PN). | 14.  |
Spares analysis, lifetime buy | Forecast the number of spare parts needed to support a system through the end of anticipated system useful life. | 15.  |
Field MTBF calculator | Computes the lower one-sided MTBF at a given confidence limit based on the number of unit-hours accumulated and the total number of failures. | 16.  |
Reliability growth planning | Estimate test time required to achieve a goal MTBF and develop an idealized reliability growth curve using methods described in MIL-HDBK-189, Reliability Growth Management. | 17 |
Reliability growth tracking | Enter equipment failure times and track reliability growth using the Crow-AMSAA model and the methods described in MIL-HDBK-189, Reliability Growth Management. | 18.  |
Confidence limits, exponential distribution | Calculate confidence limits for equipment failing in accordance with the exponential distribution. | 18a.  |
Confidence limits, normal distribution | Calculate confidence intervals around point estimates of mean life for items whose lifetimes are assumed to be normally distributed. | 19.  |
Confidence limits, binomal distribution | Calculate exact one-sided or two-sided confidence intervals based on the binomial distribution. Use for one-shot device testing and go/no-go type tests. | 19a.  |
Sample size, binomal distribution | This tool calculates test sample size required to demonstrate a reliability value at a given confidence level. It includes options for both non-parametric and parametric reliability inputs. | 20.  |
Test time calculator | Calculate the time required to demonstrate an MTBF with a specified confidence level, assuming an exponential failure distribution. | 20a.  |
Sequential test time calculator | Calculate the time required to demonstrate an MTBF using a sequential reliability test. | 20b.  |
Sequential lot acceptance test calculator | Calculate acceptance and rejection numbers for sequential lot acceptance testing. | 21.  |
Probability of sample acceptance | Given a defect density, sample size and the number of allowable defects, calculate the probability of acceptance using the cumulative binomial distribution. | 22.  |
Reliability, binomial distribution | Given a probability of an event, sample size and the number of allowable events, calculate the probability of r, or fewer events using the cumulative binomial distribution. | 23.  |
Reliability, exponential distribution | Given a mean time between failure (MTBF) or failure rate, the reliability can be determined at a specific point in time. | 24.  |
Reliability, normal distribution | Given a mean life and standard deviation, the reliability can be determined at a specific point in time. | 25.  |
Reliability, weibull distribution | Given a characteristic life and distribution shape parameter, the reliability can be determined at a specific point in time. | 26.  |
Weibull analysis | Given time-to-failure data, this tool performs a Weibull data analysis to determine the Weibull shape parameter (β) and characteristic life (η). | 27.  |
Weibull prediction of future failures | Given a population of N items placed on test, this tool calculates the expected number of failures for some future time interval based on the following two inputs: 1. the estimated Weibull shape parameter and 2. some number of failures (X>=1) during the initial time interval (t1). |
28.  |
Conditional weibull distribution | This tool implements calculations for the conditional Weibull distribution, which can be used to answer questions such as: 1. Given that an item has survived for 6.5 years, what is the expected mean age at failure? 2. Given that an item has survived for 6.5 years, what is the expected median age at failure? 3. Given that an item has survived for 6.5 years, what is the probability of survival to an age of 13 years old? |
28a.  |
Conditional weibull distribution survival table | This tool generates a survival table showing the probability of item survival over a range of item ages and additional time periods. It uses the conditional Weibull distribution and is identical to the "item 3 calculation" in the tool immediately above. It allows exporting results to Microsoft Excel. | 29.  |
Mechanical reliability data | Failure Rate Estimates for Mechanical Components. Make average failure rate estimates for items that do not exhibit a constant failure rate, such as for mechanical components. Given a Weibull shape parameter (β), characteristic life (η) and a planned maintenance interval, T, when the item is renewed to "as good as new," this tool estimates the average item failure rate. | 29a.  |
L10 life to MTBF conversion | Given a value of β, Lx% life and a planned maintenance interval, T, when the item is renewed to "as good as new," the tool estimates an average failure rate and MTBF. | 30.  |
MIL-HDBK-217 | Simple MIL-HDBK-217 Parts Count reliability prediction calculator. Allows exporting results to Microsoft Excel. | 31. 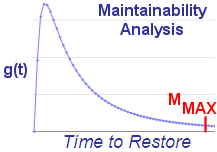 |
Maintainability analysis | Given time-to-repair data, this tool calculates the mean, median, and maximum corrective time-to-repair, assuming a lognormal distribution. | 32.  |
Reliability search | This tool assists in building a more complex Google search query that limits results to sites known to have significant reliability engineering related content. | 33.  |
Reliability standards search | Search inside all major US DoD reliability and maintainability standards (and similar documents). List and access only those pdf pages that contain keywords searched. | 34.  |
Reliability books | Reliability engineering related books, including quick links to related resources and topical YouTube videos. | 35.  |
Blog | Blog focused on system reliability analysis, with some examples of these tools applied (click "Toolkit examples" tag in right hand column). |
