Reliability Analytics CorporationPowered by Google App Engine

Maintainability Analysis

Background:

1. Calculate Metrics Based on Repair Time Data
Given time-to-repair data, this tool calculates the mean, median, and maximum corrective time-to-repair, assuming a lognormal time-to-repair distribution. 
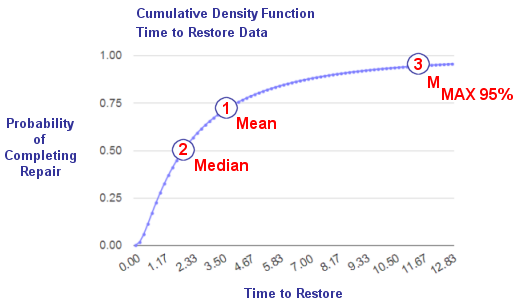
Some of the commonly used maintainability engineering terms are shown on maintainability function, M(t), illustrated below. The M(t) curve is a cumulative density function that provides an estimate of the probability of completing an arbitrary system repair action in a given amount of time. Points 1, 2, and 3 shown in the figure identify the mean, median, and maximum corrective time-to-repair, respectively. Given time-to-repair data, this tool calculates the time values associated with these points. For further details, see this blog post and reference 1 below. For a quick example, skip inputs one and two and select the test set in the Options area below.


2. Estimate MMax Based on a Known MTTR
In the absence having actual data for computing the standard deviations of repair times, the exponential distribution is often used as an approximation of the lognormal distributing for estimating the maximum corrective maintenance time for system repair actions. Using this approximation, say to estimate the maximum repair time for 95% of all repair actions, requires only a known mean time to repair (MTTR). This approximation is given by the following equation:
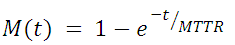
where:
    M(t) = probability of repair in a specified time t
    MTTR = mean time to repair
To make this calculation, ignore input box 1 input, set input 2 and enter an MTTR in the Options area. Plots are also an option.

Calculation Inputs:

1. Repair times (time freq):

The input format is a repair time, followed by a single space, followed by the number of observations (frequency). For example 0.25 4, would indicate 0.25 hours to repair was observed four times. As an alternate input method, two columns from Excel may be pasted into the box above (repair time, no. of observations). Example repair times

2. MMAX percentile

3. Options:

Equations
M(t) Table
Plots Exp. Approx. Overlay
Decimal places:

Ignores box 1 input above:
    Use a test data set:
    Estimate MMAX based on this MTTR (hours):


Featured Reference:

Engineering Maintainability: How to Design for Reliability and Easy Maintenance


Toolkit Home

Comments/Questions:
Feedback
Reliability Analytics Corporation
reliabilityanalytics.com


References:

  1. MIL-HDBK-338, Electronic Reliability Design Handbook.
  2. Bazovsky, Igor, Reliability Theory and Practice.
  3. O'Connor, Patrick, D. T., Practical Reliability Engineering.
  4. DoD Guide for Achieving Reliability, Availability and Maintainability .
  5. MIL-HDBK-470A, Designing and Developing Maintainable Products and Systems
  6. MIL-HDBK-472, Maintainability Prediction
  7. MIL-HDBK-472, Notice 1, Maintainability Prediction
  8. MIL-HDBK-338B, Exponential Approximation to the Maintainability Function.
  9. MIL-HDBK-338, Exponential Approximation to the Maintainability Function.
  10. Birolini, Alessandro, Reliability Engineering: Theory and Practice.
  11. Ebeling, Charles E. An Introduction to Reliability and Maintainability Engineering.
  12. Blanchard, Benjamin S.; Verma, Dinesh C.; Peterson, Elmer L. An Introduction to Reliability and Maintainability Engineering.
  13. Dhillon, B.S. Engineering Maintainability: How to Design for Reliability and Easy Maintenance.