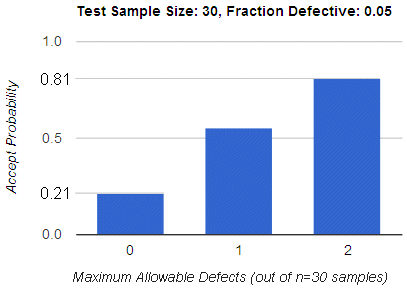

Probability of Sample Acceptance
The binomial distribution is frequently used to model the number of successes in a sample of size n drawn with replacement from a population of size N. If the sampling is carried out without replacement, the draws are not independent and so the resulting distribution is a hypergeometric distribution, not a binomial one. However, for N much larger than n, the binomial distribution is a good approximation, and widely used.
Given some number of allowable defects (x) and a probability (p) of randomly selecting a defective item, this tool calculates the probability of lot acceptance. The cumulative probability F of selecting no more than r defective items is:

For example, given a test sample of n=30 items from a production line that historically produces 5% defective product (p=0.05, q=0.95), there is a 0.21 probability of lot acceptance if zero defects are allowed. This probability increases to 0.81 if two defects (r=2) are allowed.

Calculation Inputs:


