Reliability Analytics CorporationPowered by Google App Engine

Sequential Testing: Testing the Mean of a Binomial Distribution

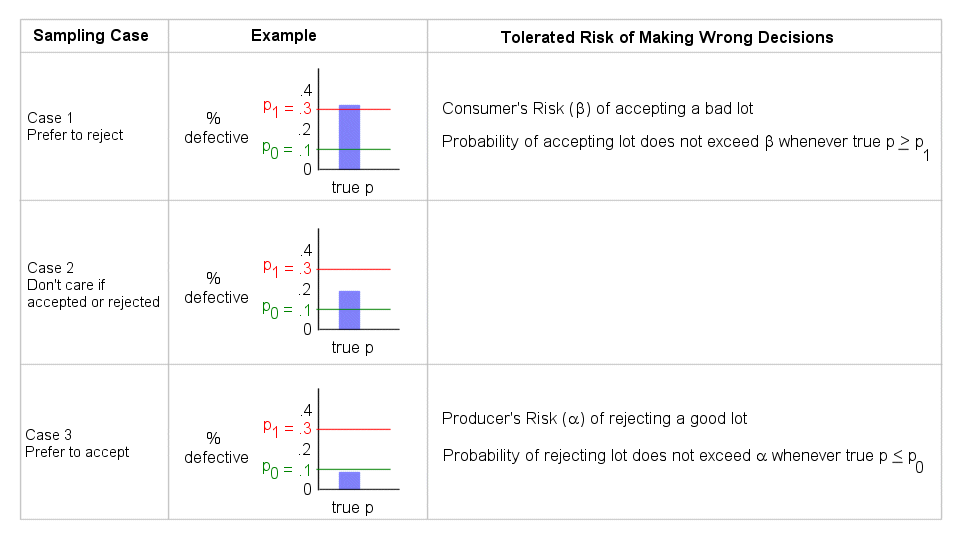
This tool provides the ability to plan a sequential lot acceptance test where each unit is classified into one of two categories, good or defective. It is based on the work of Abraham Wald (Ref. 2). The following shows the possible sampling outcomes and the preferences for test decision outcome. "true p" in the example column below is the true proportion defective in the lot if all units were to be inspected. See reference 2, Chapter 5, "Testing the Mean of a Binomial Distribution (Acceptance Inspection of a Lot Where Each Unit is Classified Into One of Two Categories)" for additional details.
Sequential sampling test cases
Calculator input parameters are as follows:

Tip: To experiment with the test methodology select "simulation" in the chart overlay pull down and vary input parameters (1-4) along with "true p" (input 5C).


Calculation Inputs:

1. Unacceptable proportion defective, p1 (1 > p1 > p0):
2. Acceptable proportion defective, p0 (0 < p0 < p1):
3. Consumers risk (β)
4. Producers risk (α)

5. Optional:

5A. x axis scale factor Table

Chart overlay:

5B. Number of defects observed (# inspected, # defects observed):

Above input is:
a. comma separated entry, one per line: # inspected, # defects observed
b. copy/paste two columns from Excel: # inspected    # defects observed
Excel template

5C. Simulation true proportion defective (range: 0 to 1.0): Number of tests:


Featured Reference:

Reliability Theory and Practice


Toolkit Home

Comments/Questions:
Feedback
Reliability Analytics Corporation
reliabilityanalytics.com


References:

  1. Bazovsky, Igor, Reliability Theory and Practice.
  2. Wald, A., Sequential Analysis.
  3. Wald, A. (1945). Sequential tests of statistical hypotheses. Annual Mathematica Statistics. 16, 117-186.
  4. http://en.wikipedia.org/wiki/Sequential_analysis