Reliability Analytics CorporationPowered by Google App Engine

Sample Size Calculator - Binomial Reliability Demonstration Test

This calculator is used to calculate the number of test samples required to demonstrate a required level of reliability at a given confidence level. It can be used to answer questions such as:

1. How many test samples are required to demonstrate 95% reliability at a 95% confidence level?
2. How much test time is needed to demonstrate 90% reliability at a 90% confidence level?
3. Given some amount of available test time, how many test samples are needed to demonstrate 80% reliability at an 80% confidence level?

Option 1 above uses a non-parametric test approach, while options 2 and 3 assume a Weibull distribution to relate reliability to test time, which is termed a parametric binomial reliability demonstration test.

Method 1 (non-parametric test). This tool calculates test sample size required to demonstrate a reliability value at a given confidence level. The calculation is based on the following binomial equation:
Binomial Equation
where:
    C is the test confidence level
    R is the reliability to be demonstrated
    f is the number of allowable test failures
    n is the test sample size

Given inputs of C, R and f, this tool solves the above equation for sample size, n.

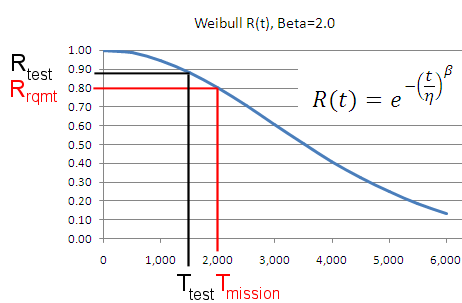
Method 2 (parametric test). Method 2 makes use of the Weibull distribution to define the reliability (R) in the the above binomial equation. Given a reliability requirement Rrqmt for a mission time Tmission and a value for the Weibull shape parameter β, the Weibull reliability function is solved for characteristic life (η). This fully defines the Weibull reliability function and allows for the calculation of reliability at any other point on the curve below. Rtest associated with some available test time Ttest is then calculated and used in the above binomial equation to calculate the number of test samples needed. Threfore, demonstrating Rtest at time Ttest is equivalent to demonstrating Rrqmt, provided that the estimate of β is accurate. Method 2A solves for required sample size. Conversely, given a fixed number of samples, Method 2B solves for test time required.
.
Binomial Equation

Calculation Inputs:

1. Select method:
Method 1
Non-Parametric Binomial Reliability Demonstration Test
Method 2A
Parametric Binomial Reliability Demonstration Test
(Calculate Samples)
Method 2B
Parametric Binomial Reliability Demonstration Test
(Calculate Test Time)
2. Number of allowable test failures (f):
3. Reliability requirement (R):
4. Test confidence level (C):
5. Test options table:
6. OC curve:


2. Number of allowable test failures (f):
3a. Reliability requirement at Tmission (Rrqmt):
3b. Mission time (Tmission, hours):
3c. Weibull shape parameter (β):
4. Test confidence level (C):
5. Available test time (Ttest, hours):
6. Generate test options table:
2. Number of allowable test failures (f):
3a. Reliability requirement at Tmission (Rrqmt):
3b. Mission time (Tmission, hours):
3c. Weibull shape parameter (β):
4. Test confidence level (C):
5. Sample size (n):
6. Generate test options table:


Featured Reference:

Introduction to Statistical Quality Control


Toolkit Home

Comments/Questions:
Feedback
Reliability Analytics Corporation
reliabilityanalytics.com


References:

  1. http://www.itl.nist.gov/div898/handbook/prc/section2/prc241.htm.
  2. MIL-HDBK-338, Electronic Reliability Design Handbook.
  3. http://en.wikipedia.org/wiki/Binomial_proportion_confidence_interval
  4. http://en.wikipedia.org/wiki/Binomial_distribution
  5. http://reliabilityanalyticstoolkit.appspot.com/binomial_confidence
  6. Mathews, Paul Sample Size Calculations: Practical Methods for Engineers and Scientists.
  7. Ryan, Thomas P. Sample Size Determination and Power.
  8. Collani, E. von; Drager, Klaus Binomial Distribution Handbook for Scientists and Engineers.
  9. Calculating Test Sample Sizes with Microsoft Excel.xlsx