
Failure Rate Estimates for Mechanical Components
Background:
This tool can be used to make average failure rate estimates for items that do not exhibit a constant failure rate, such as for mechanical components. Given a Weibull shape parameter (β),
characteristic life (η) and a maintenance interval for item renewal, T, when the item is assumed to be restored to "as good as new," this tool estimates an average item failure rate for the assumed maintenance concept.
The average failure rate is calculated using the following equation (Ref. 2), where T is the maintenance interval for item renewal and R(t) is the Weibull reliability function
with the appropriate β and η parameters. The characteristic life (η) is the point where 63.2% of the population will fail.

Example: A ball bearing has a Weibull shape parameter of 1.3 and characteristic life of 50,000 hours. What is the average failure rate for the bearing? If the bearing is scheduled for
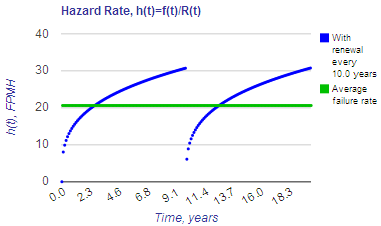
preventive maintenance replacement every 10 years, the hazard rate varies from a lower value of zero at "time zero" to an upper bound of 31 failures per million hours (FPMH) for bearings that survive to the 10 year point. The average failure rate for a population of these bearings is estimated
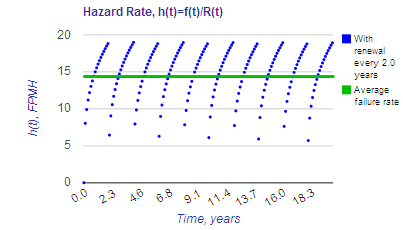
to be approximately 20 FPMH, as depicted by the green line shown in the left-hand figure below. Conversely, if the bearing is replaced every 2 years, the failure rate will vary between 0 at "time zero" to 19 FPMH at the two year point,
with the average failure rate estimated to be 14 FPMH, as represented by the green line in the right-hand figure. Because average component failure rate is constant for a given maintenance renewal concept, an overall system failure rate can be estimated by summing the average failure rates of the components that make up a system.


Calculation Inputs:
The table below shows a summary of "starting point estimates" for mechanical device failure rates, in failures per million hours (FPMH), for the device categories covered in
the Handbook of Reliability Prediction Procedures for Mechanical Equipment NSWC-11 (ref. 4). These estimates are shown for three device renewal intervals,
two years, eight years and 15 years. The device is assumed to be "as good as new" after renewal. The assumed Weibull shape parameter and characteristic life is shown in columns two
and three. These estimates are based primarily on Barranger "typical" estimates for similarly named device categories (ref. 1). Mechanical device failure rates are ultimately dependent on
a multitude of factors, including specific device characteristics, applied loads, duty cycle and failure definition. Click the N in the description field to go directly to the relevant NSWC-11 handbook section, which provides further information on failure modes, mechanisms and application considerations. Reference 1
provides very broad ranges for Weibull characteristic life and shape parameter estimates, which can have a very significant impact on the estimated failure rate. Larger estimates of beta
indicate a more pronounced end of life wearout phase. Larger estimates of characteristic life (the point where 63.2 % of the population is expected to fail) indicates a more durable device, or lower
applied loads. The user should adjust these estimates based on the specific application and their own engineering judgment. Questions such as the following may be helpful in making revised estimates:
- For my application, would I expect most devices to fail in "x years?" For this question, "most devices" means 63 % of the population. If the answer is no, then a longer characteristic life should be chosen.
- Would I expect the device to wearout, or are failures expected to occur more randomly over time? Rapid wearout is modeled using larger values of β, whereas if the population of devices is
expected to fail randomly, or to contain a mixture of defective devices and "good" devices, a value closer to 1.0 may be more appropriate.
| Description |
β |
η (Years) |
2-Year Renewal Interval (FPMH) |
8-Year Renewal Interval (FPMH) |
15-Year Renewal Interval (FPMH) |
|
1.4 |
3 |
31 |
41 |
42 |
|
1.4 |
3 |
31 |
41 |
42 |
|
1.4 |
3 |
31 |
41 |
42 |
|
1.1 |
3 |
36 |
39 |
39 |
|
1.1 |
3 |
36 |
39 |
39 |
|
1.1 |
3 |
36 |
39 |
39 |
|
1.1 |
9 |
11 |
12 |
13 |
|
1.0 |
10 |
11 |
11 |
11 |
|
1.0 |
11 |
10 |
10 |
10 |
|
1.0 |
17 |
6.7 |
6.7 |
6.7 |
|
1.3 |
5 |
17 |
23 |
25 |
|
1.3 |
6 |
13 |
19 |
20 |
|
1.0 |
6 |
19 |
19 |
19 |
|
1.2 |
8 |
11 |
14 |
15 |
|
2.0 |
9 |
2.8 |
9.9 |
14 |
|
2.0 |
9 |
2.8 |
9.9 |
14 |
|
2.0 |
9 |
2.8 |
9.9 |
14 |
|
2.0 |
9 |
2.8 |
9.9 |
14 |
|
2.0 |
9 |
2.8 |
9.9 |
14 |
|
1.2 |
11 |
7.3 |
9.4 |
10 |
|
2.0 |
9 |
2.8 |
9.9 |
14 |
|
1.2 |
4 |
24 |
29 |
30 |
|
1.2 |
4 |
24 |
29 |
30 |
|
1.2 |
6 |
15 |
19 |
20 |
|
1.2 |
6 |
15 |
19 |
20 |
|
1.1 |
3 |
36 |
39 |
39 |
|
1.4 |
11 |
5.2 |
8.7 |
10 |
|
1.4 |
11 |
5.2 |
8.7 |
10 |
|
1.4 |
11 |
5.2 |
8.7 |
10 |
|
1.4 |
11 |
5.2 |
8.7 |
10 |
|
1.4 |
11 |
5.2 |
8.7 |
10 |
|
1.4 |
11 |
5.2 |
8.7 |
10 |
|
1.4 |
11 |
5.2 |
8.7 |
10 |
|
1.4 |
11 |
5.2 |
8.7 |
10 |
|
1.4 |
11 |
5.2 |
8.7 |
10 |
|
1.4 |
11 |
5.2 |
8.7 |
10 |
|
1.4 |
11 |
5.2 |
8.7 |
10 |
|
1.0 |
17 |
6.7 |
6.7 |
6.7 |
|
1.9 |
7 |
5.2 |
15 |
18 |
|
1.9 |
7 |
5.2 |
15 |
18 |
|
1.9 |
7 |
5.2 |
15 |
18 |
|
1.2 |
6 |
15 |
19 |
20 |
|
1.2 |
11 |
7.3 |
9.4 |
10 |
|
1.4 |
114 |
0.20 |
0.35 |
0.44 |
|
3.0 |
34 |
0.012 |
0.19 |
0.64 |
|
3.0 |
34 |
0.012 |
0.19 |
0.64 |
|
2.0 |
9 |
2.8 |
9.9 |
14 |
|
2.0 |
9 |
2.8 |
9.9 |
14 |
|
2.0 |
9 |
2.8 |
9.9 |
14 |
|
2.0 |
34 |
0.20 |
0.78 |
1.4 |
|
2.0 |
34 |
0.20 |
0.78 |
1.4 |
|
2.0 |
34 |
0.20 |
0.78 |
1.4 |
|
1.2 |
6 |
15 |
19 |
20 |
|
1.0 |
2 |
57 |
57 |
57 |
|
1.2 |
3 |
34 |
40 |
40 |
|
1.2 |
6 |
15 |
19 |
20 |
|
3.0 |
34 |
0.012 |
0.19 |
0.64 |
|
2.0 |
9 |
2.8 |
9.9 |
14 |
|
3.0 |
23 |
0.038 |
0.59 |
2.0 |
|
3.0 |
34 |
0.012 |
0.19 |
0.64 |
Featured Reference:
 Fatigue testing and analysis of results
Toolkit Home
Comments/Questions:


reliabilityanalytics.com
References:
- Barringer, Paul, Barringer & Associates, Inc., database of typical Weibull shape and characteristic life parameters (wdbase), Feb. 22, 2010 (no longer available online).
- Bazovsky, Igor, Reliability Theory and Practice.
- Bloch, Heinz P., Practical Machinery Management for Process Plants.
- Handbook of Reliability Prediction Procedures for Mechanical Equipment NSWC-11.
- Selected articles from www.powertransmission.com related to reliability and life of mechanical components.
- Typical Failure Rates for Sensing Elements 1 (thermistor, thermocouple, infrared sensor, thermostat, force transducer, strain gauge, fluid pressure sensor, fluid flow sensor, fluid level sensor, air flow sensor, photodiode, phototransistor, photodetector, solar cell, potentiometer, optical rotary encoder, magnetic rotary encoder, displacement sensor, velocity sensor, proximity sensor, infrared sensor, altitude, humidity, accelerometer, strain gauge, smoke detection).
- Typical Failure Rates for Sensing Elements 2 (accelerometer, hall effect switch, pneumatic switch, solid state device, thermocouple, torque sensing device, fluid flow sensor, air flow sensor, pressure sensor, fluid level sensor, humidity sensor).
- Chandler, Gregory; Denson, William K.; Rossi, Michael J.; Wanner, Richard Nonelectronic Parts Reliability Data - NPRD-91.
- Bloch, Heinz P. Introduction to Machinery Reliability Assessment.
Copyright © 2010 - 2023 Reliability Analytics Corporation
Privacy Policy
All content and materials on this site are provided "as is" Reliability Analytics makes no warranty, express or implied, including the warranties of merchantability and fitness for a
particular purpose; nor assumes any legal liability or responsibility for the accuracy, completeness, or usefulness of any information, apparatus, product, or process disclosed;
nor represents that its use would not infringe privately owned rights.


