
Reliability and Effective Failure Rate of "n-m" Standby Redundant Units, with "m" Required for Success
Background:
Return to Redundancy Calculator
The tool provides the following capabilities:
1. Reliability Function
It provides the reliability function, R(t), based on the redundancy level entered. R(t) is derived using the most
general R(t) equation for "m of n Must Be Working", for "n" fully energized identical parallel units, as shown on page 160 of the
Reliability Toolkit: Commercial Practices Edition (Ref. 2).

This equation has been further modified to factor in the probability that the switching mechanism works
correctly. Each term in the above summation for k>0 represents one additional failure in the overall system, an thus an additional switching action.
Therefore, each term for k>0 is multiplied by the probability P that the switch will work correctly.
For example, for a system of three units (n=3), with one unit required (m=1) for success and two units that are cold standby spares (n-m=2):


The first term represents the probability of no failures, the second term the probability of exactly one failure (requiring one switching action) and the third term the probability of two failures (requiring a second switching action).
The above assumes perfect switching. If each switching action is imperfect and occurs with probability P, then the overall probability of success is:

2. Effective MTBF
It uses Gauss Integration to numerically evaluate the following equation.

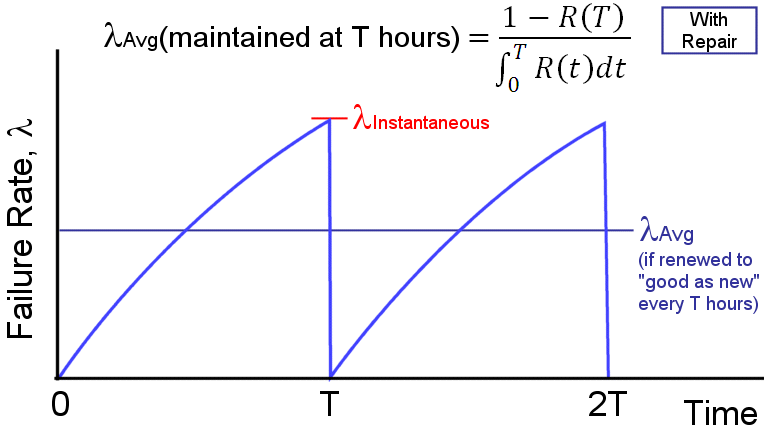
where T is the maintenance interval (i.e., the system is restored to "as good as new" every T hours). The effective failure rate is the reciprocal of the effective MTBF. The following figure
shows the concept of effective, or average failure rate, over time as the system is renewed every T hours. The instantaneous system failure rate, which increases over time as redundant
units fail, is shown at time T. This failure rate increases over time as redundant units fail and less fault tolerance remains.

3. MTTF
It calculates mean time to failure (MTTF) using Gauss Integration:

4. Excel Output
It also allows for the output of the derived reliability function, R(t), as a Microsoft Excel formula, thereby allowing for manipulation and plot generation within Microsoft Excel.

5. Text Output
It also allows for the output of the derived reliability function, R(t), as a text string that can be directly used in a Python programming language lambda function, thereby allowing for further customized reliability modeling
within the Python programming environment. For example, the following picture shows text output highlighted in yellow. In the Pythion shell shown on the right, this text is pasted into a Python lambda function
that takes inputs (in this example) of t, gamma, eta and beta; thereby, allowing easy computation of reliability for any combination of these inputs. Python is available from http://python.org/, or an on-line version
of the Python shell is available by clicking the calculator icon in the lower right-hand corner of this page.

Toolkit Home
Comments/Questions:


reliabilityanalytics.com
References:
-
United States Air Force Rome Laboratory Reliability Engineer's Toolkit (1993).
- Reliability Toolkit: Commercial Practices Edition, United States Air Force Rome Laboratory and the DoD Reliability Analysis Center, (1995). Available from: http://src.alionscience.com/src/products.do?action=detail&code=CPE
- MIL-HDBK-338, Electronic Reliability Design Handbook.
- Klion, Jerome, A Redundancy Notebook, Rome Air Development Center, RADC-TR-77-287, December 1987.
- Reliability Modeling and Prediction, MIL-STD-756B, November 1981.
- McGregor, Malcolm A., Approximation Formulas for Reliability with Repair, IEEE Transactions on Reliability, Volume R-12, Number 4, December 1963.
- Bazovsky, Igor, Reliability Theory and Practice.
- O'Connor, Patrick, D. T., Practical Reliability Engineering.
- Barranger, Paul, See http://www.barringer1.com/wdbase.htm for a database of typical Weibull shape and characteristic life parameters.
- http://en.wikipedia.org/wiki/Gaussian_quadrature
- Birolini, Alessandro, Reliability Engineering: Theory and Practice.
Copyright © 2010 - 2023 Reliability Analytics Corporation
Privacy Policy
All content and materials on this site are provided "as is" Reliability Analytics makes no warranty, express or implied, including the warranties of merchantability and fitness for a
particular purpose; nor assumes any legal liability or responsibility for the accuracy, completeness, or usefulness of any information, apparatus, product, or process disclosed;
nor represents that its use would not infringe privately owned rights.


